
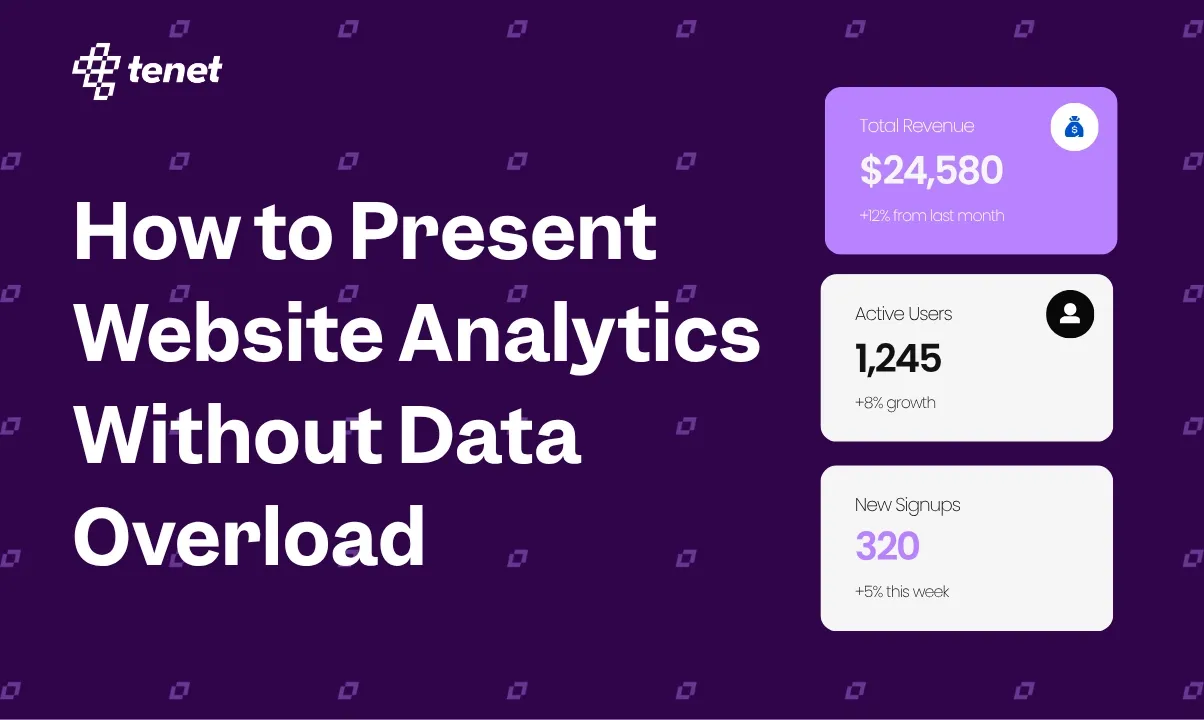
How to Present Website Analytics Without Data Overload
 By
Share

Share
Get a quick blog summary with



Suppose you have a client meeting coming up. Your team opens the analytics dashboard to prepare the report and finds hundreds of numbers across traffic, sessions, conversions, channels, landing pages, campaigns, devices, locations, and more.
The problem is not that you have too little data. You have too much of it.
When presenting website performance to a client, founder, investor, or board, the objective is not to prove that you have collected data. It is to explain:
- What happened?
- Why did it happen?
- What does it mean for the business?
- What should we do next?
A good analytics presentation reduces complexity. It does not display all of it.
The same principle applies whether an agency is presenting a monthly marketing report to a client or a startup founder is presenting growth data to potential investors or the board. The audience does not need to see every number. They need to understand the numbers that matter and what they mean.
Being a leading design agency, we have designed hundreds of pitch decks, dashboards, marketing reports, and other marketing collateral for startups, growing businesses, and Fortune 500 brands. One thing we have learned is that good reporting is less about adding more data and more about presenting the right data in the right way.
Here is a simple and practical overview of how to present website analytics clearly, avoid data overload, and turn numbers into insights that people can actually act on.
The Right Way to Present Website Analytics
Presenting website analytics is not about showing every metric you have. It is about selecting the numbers that matter, putting them in context, and making the key insights easy to understand. Here is a simple process to follow.
1. Start With the Audience, Not the Analytics Dashboard
Every analytics presentation has a different audience, and that audience determines what you should include.
A marketing client may want to understand campaign performance, while a founder may care more about leads, revenue, and growth. An investor or board may need a much higher-level view of business performance.
The complexity of the report should also depend on who is going to see it, what they already know, and what decisions they need to make. Before opening your analytics dashboard and selecting metrics, first understand your audience and what they actually need from the report.
The goal is simple to show each audience the data they need to understand the situation and make a decision, not everything your analytics platform can measure.
Also Read: Slides You Must Include in an Investor Pitch Deck
2. Turn Numbers Into a Story
Your audience does not just want to see numbers. They want to understand what those numbers actually mean. While numbers are important, they become much more useful when you explain what changed, why it changed, and what it means for the business.
For example, instead of simply saying:
Organic traffic increased by 32%.
You can present it as:
Organic traffic increased by 32% after expanding our content around high-intent topics, which also helped increase organic leads by 21%.
The second version gives the audience context. It connects the result to the work behind it and shows the business impact.
A simple way to structure your story is:
What happened → Why it happened → What it means → What we should do next
This helps turn a collection of analytics metrics into a clear story that your client, founder, or investor can understand quickly.
3. Use Trends Instead of Isolated Numbers
Isolated numbers often take away the context your audience needs to understand performance. Instead of showing a metric on its own, show how it has changed over time and what caused that change.
For example, instead of saying:
42,000 website visitors
say:
42,000 visitors, up 18% from last month and 47% from the same period last year.
Even if the number is slightly down, do not hide it. Explain why it happened and what you are doing about it. For example, a seasonal drop in traffic may be expected, while a decline caused by a technical issue or campaign change needs a different response.
The goal is to show the trend, context, reason, and next step, rather than presenting a number without a story.
A recent board-reporting framework similarly recommends using a focused set of metrics that explains performance, what changed, why it changed, and what decision may be required, rather than putting every internal KPI into the board deck.
4. Use the Right Chart for the Right Question
It is always tempting to add charts when you have a lot of data to present. But not every chart makes the information easier to understand. Each chart should help answer a specific question and make the important takeaway easier to see.
Before adding a chart, ask yourself: What question is this visual helping the audience answer?
When the Report Is Going to Investors or the Board
When the audience changes from a marketing team or client to investors or the board, your approach should change too. The presentation needs to move from marketing performance to business performance.
Founders should avoid presenting investors with a large website analytics dashboard filled with traffic sources, page views, sessions, and other detailed metrics. Instead, connect website metrics to the business model and show how digital activity contributes to growth.
For a SaaS company, website analytics may be only the first layer of the story. Investors may care more about growth, retention, acquisition efficiency, revenue, customer quality, and cash efficiency.
For example:
Website traffic → Sign-ups → Activated users → Paying customers → Revenue
This gives investors a much clearer picture of how the website contributes to the wider business.
It is also worth presenting this information in a professional, structured format. Tools such as an AI PowerPoint generator can help turn your facts, figures, insights, and supporting data into presentation-ready slides and visuals quickly. This can reduce the time spent manually formatting charts, arranging information, and building slides, while your team can focus on getting the story and insights right.
The technology should support the presentation, not replace the thinking behind it. The most important part is still deciding which numbers matter and what they mean for the business.
Analytics Presentation Checklist
Before presenting your analytics report, run through this quick checklist to make sure the story is clear and focused.
- Does the first slide communicate the main takeaway?
- Are the most important metrics connected to business outcomes?
- Is the comparison period clearly mentioned?
- Does every chart answer a specific question?
- Have unnecessary metrics been removed?
- Can the audience understand the story without opening the analytics dashboard?
- Have you explained why important numbers changed?
- Are your key insights clearly highlighted?
- Are your recommendations based on the data?
- Is detailed supporting data available in the appendix if needed?
- Can the audience clearly see what should happen next?
Make the Data Easy to Understand and Act On
Some reports have plenty of data but still fail to communicate the right story. Even with strong results, a weak presentation can make the information difficult to understand.
The goal is not to show everything. It is to tell a clear story, present what matters, explain why it matters, and skip what does not help the audience make a decision.
When we present marketing reports to our clients, whether it is an SEO report, PPC report, or a broader website performance report, the focus is not on showing every metric available. We focus on the metrics that matter to the business, the changes that need attention, what drove those changes, and what we recommend doing next.
A good analytics presentation should leave the audience with three clear answers:
What happened? Why did it happen? What should we do next?
That is what turns website analytics from a collection of numbers into a useful business story.
Expertise Delivered Straight to Your Inbox
Expertise Delivered Straight to Your Inbox























Got an idea on your mind?
We’d love to hear about your brand, your visions, current challenges, even if you’re not sure what your next step is.
Let’s talk


