40+ Updated Perplexity AI User Statistics Relevant For 2026
Share
Share
Get a quick blog summary with


Perplexity AI is one of the fastest-growing AI-powered search platforms in the world. Since its launch in 2022, it has evolved from handling a few thousand daily queries to managing hundreds of millions each month.
This article compiles over 40 verified statistics from 2025, curated through research from publicly available data and trusted sources.
In this listicle roundup, we cover Perplexity’s user base, global traffic trends, device usage, performance benchmarks, and revenue growth.
📌 Note: Original source links are provided at the end of the article for reference.
Whether you're a researcher, marketer, or simply exploring the evolution of AI tools, this data-driven overview gives a clear picture of how Perplexity AI is transforming the future of search.
Key Perplexity usage statistics at a glance:
- Perplexity AI has over 22 million active users across web and mobile platforms.
- The platform processes more than 780 million search queries each month.
- It is available in 238 countries and supports 46 languages.
- India and the United States are the top sources of user traffic.
- Over 53% of users are aged 18 to 34, showing strong adoption among younger audiences.
- Mobile devices account for 63.5% of usage, while 36.5% comes from desktops.
- Average user session lasts 23 minutes and includes multiple page views.
- Perplexity delivers answers with 95% accuracy and response times of 1.2 to 2.5 seconds.
- Direct traffic accounts for 82%, reflecting strong brand loyalty.
- The company generates over $100 million in annual recurring revenue.
- As of May 2025, Perplexity AI is valued at $18 billion.
Below, you'll find a structured breakdown of the key Perplexity AI statistics, organized into 9 categories for easy reference.
1. Perplexity AI User Base and Demographics
This section covers the number of users, how often they return, and who they are. These figures show Perplexity AI’s growing popularity among global users and how it's especially favored by younger, tech-savvy professionals.
- As of 2025, Perplexity AI has 15 million active monthly users on its website alone, showing its widespread adoption as an AI-powered search assistant.
- When we include mobile app users, the total number of active users reaches 22 million, indicating strong multi-platform engagement.
- The platform retains 85% of its users, which highlights user satisfaction and ongoing trust in the tool’s performance.
- About 90% of users revisit the site within 30 days of their first visit, demonstrating strong recurring usage and engagement.
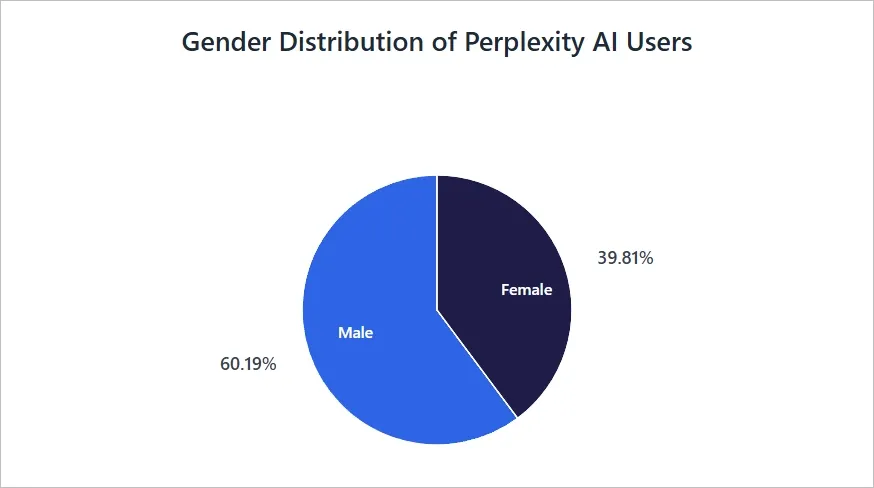
- In terms of gender, 60.19% of Perplexity AI users are male, while 39.81% are female, showing a slight skew towards a male-dominated user base.
- Over half of all visitors (53.24%) are between 18 and 34 years old, which suggests that the platform primarily attracts students, young professionals, and early-career technologists.
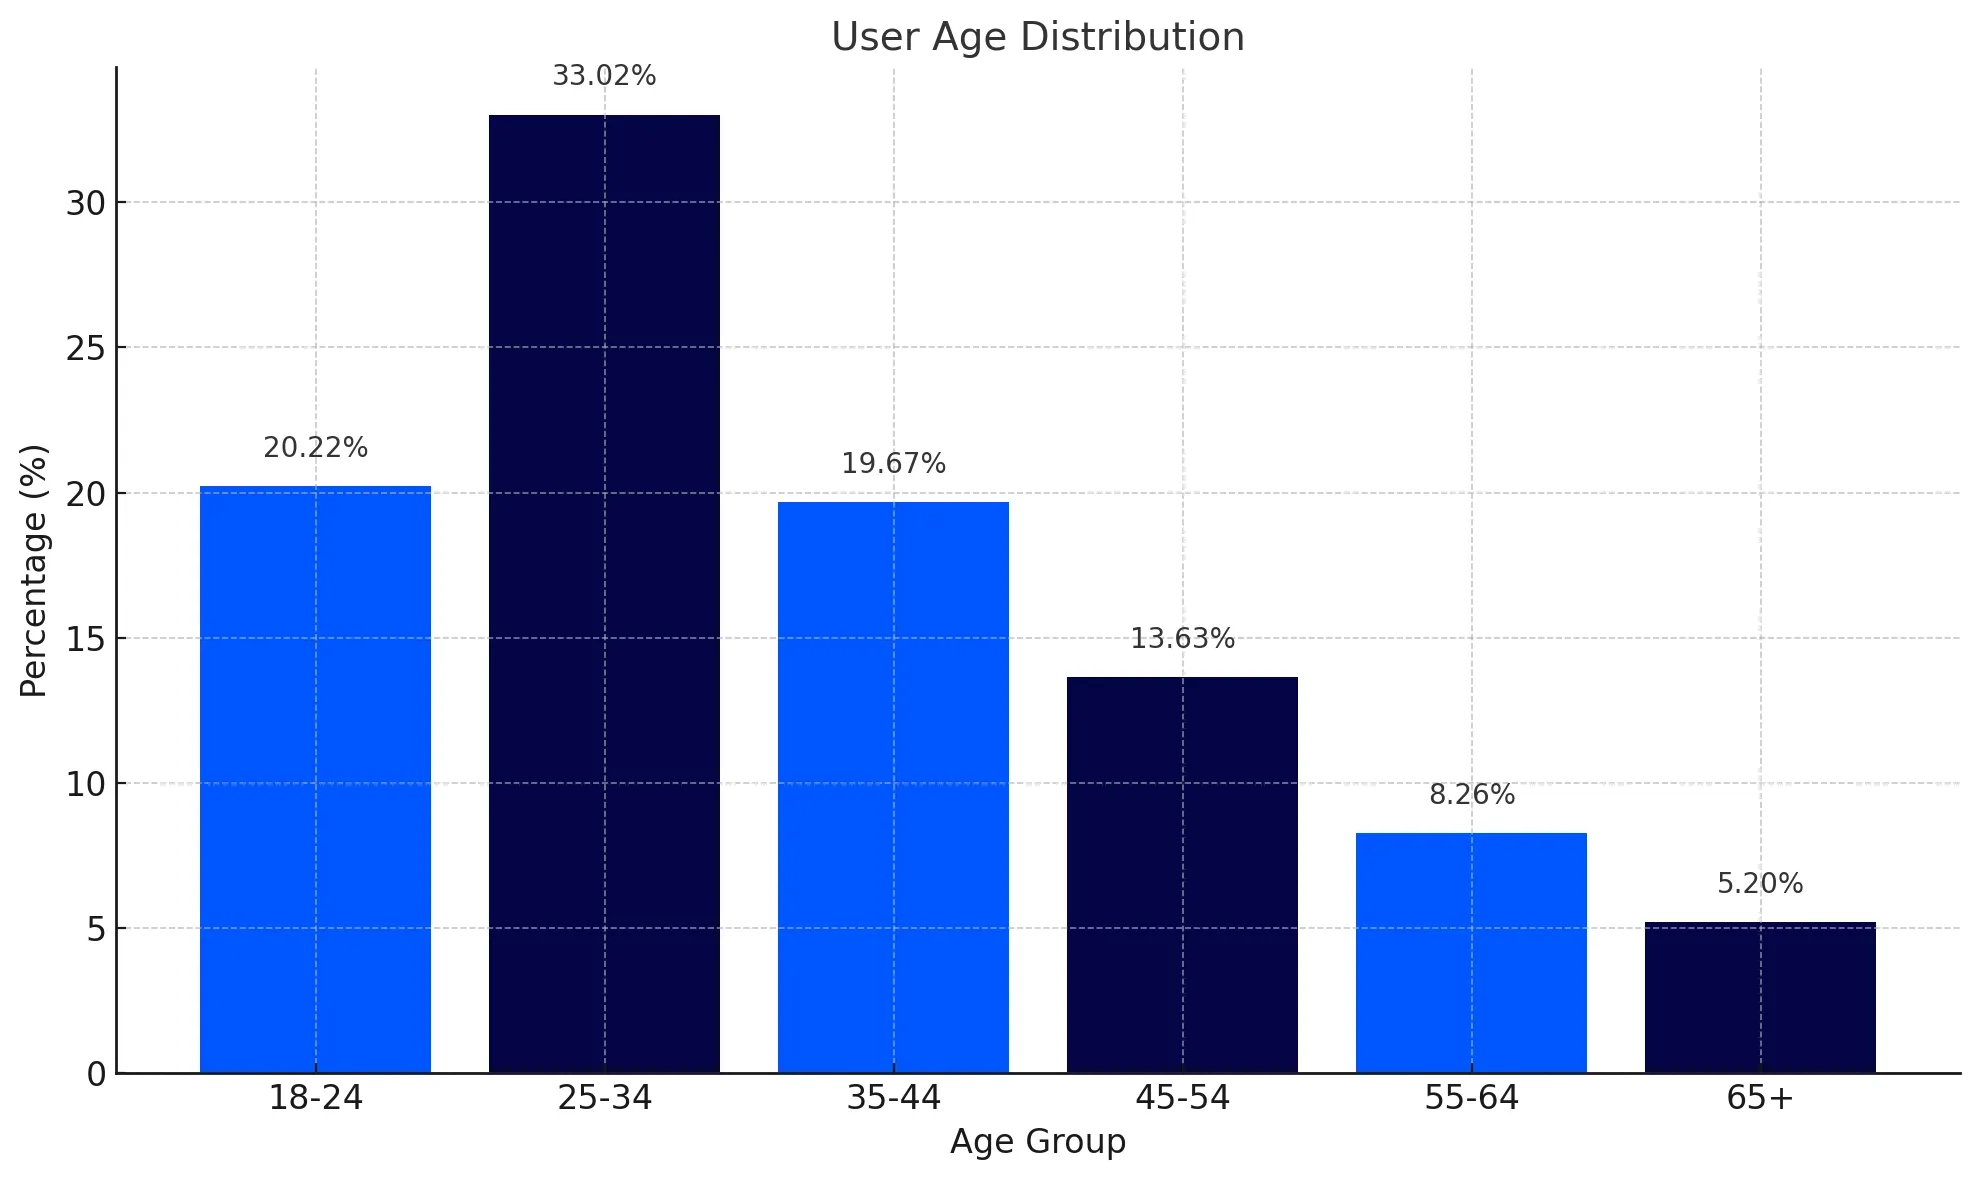
- Here's how the age groups break down in more detail:
- 20.22% of users are aged 18 to 24
- 33.02% fall in the 25 to 34 range
- 19.67% are aged 35 to 44
- 13.63% are between 45 and 54
- 8.26% are in the 55 to 64 age group
- Only 5.20% are aged 65 or older
This age distribution confirms that younger users are the dominant audience, while senior users form a smaller share.
- On average, 2 million people visit Perplexity AI every day, making it a highly active platform with consistent daily traffic.
2. Global Reach and Country-Wise Traffic of Perplexity AI
This section shows where Perplexity AI users come from, how the platform is distributed globally, and which countries drive the most traffic. It highlights Perplexity's reach across both developed and emerging markets.
- Perplexity AI is currently available in 238 countries, reflecting its global footprint and accessibility.
- The platform supports 46 different languages, enabling users across regions to interact with AI in their native language or preferred interface.
- A deeper look at web traffic by country (across all devices) reveals:
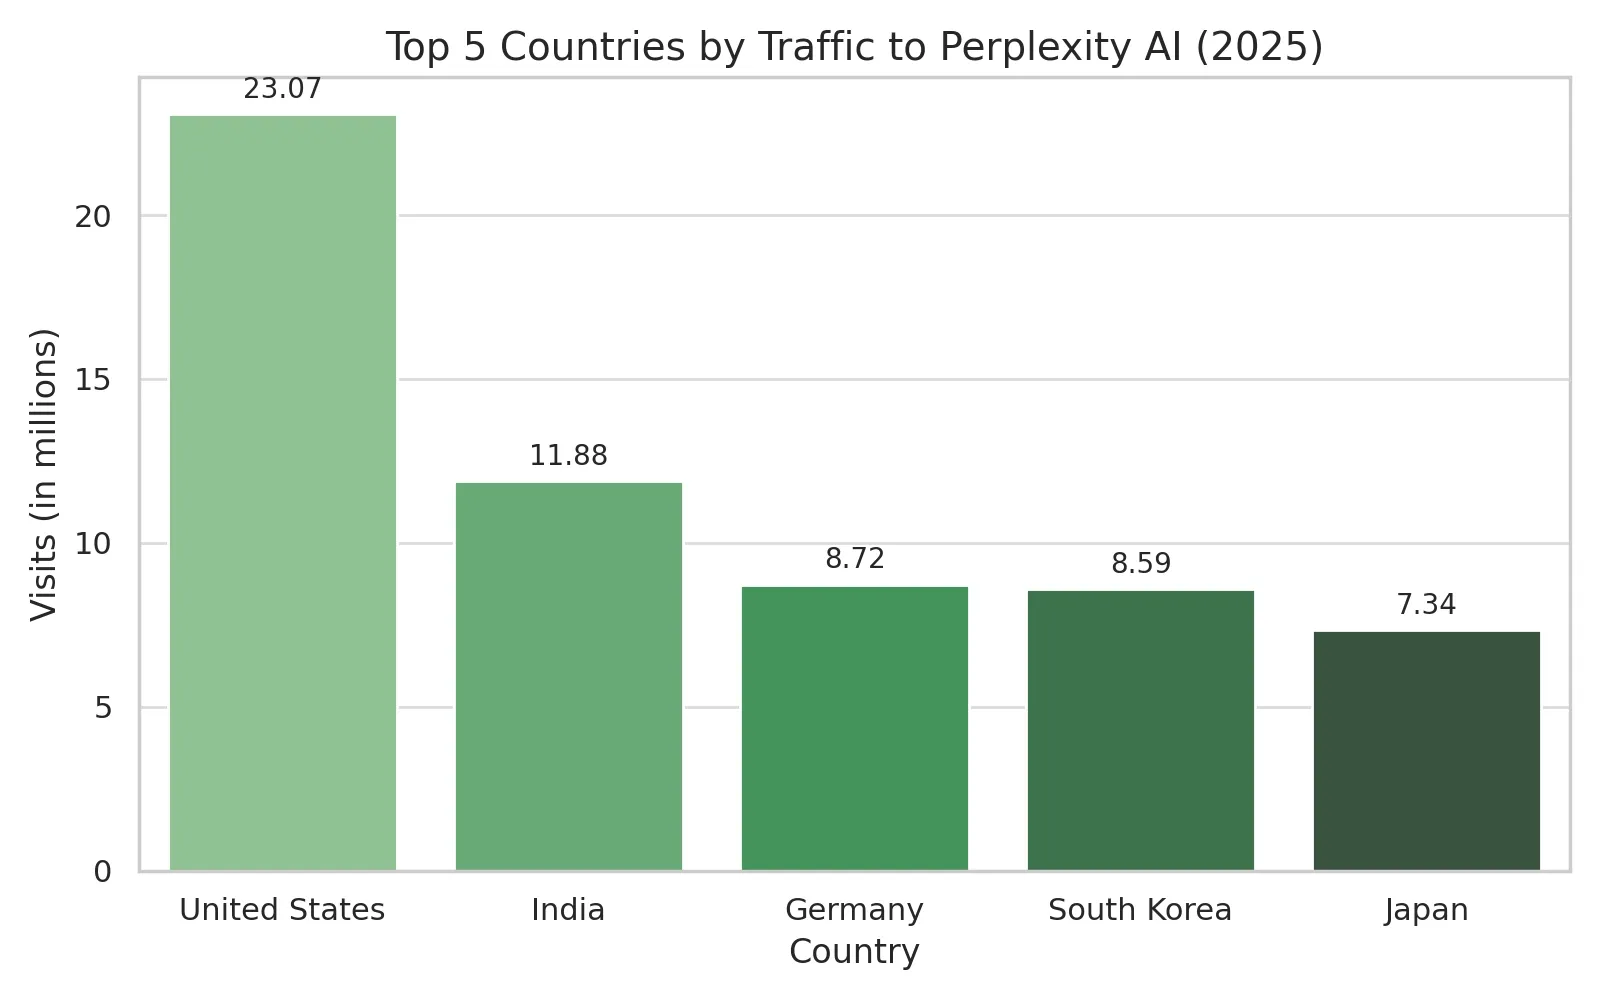
- The United States contributes 16.32% of total visits, which translates to around 23.07 million sessions.
- India drives 8.41% of traffic, equal to approximately 11.88 million visits.
- Germany generates 6.17% of visits, amounting to about 8.72 million.
- South Korea contributes 6.08%, which totals around 8.59 million visits.
- Japan accounts for 5.2%, equal to roughly 7.34 million site visits.
- These numbers confirm that while Asia drives much of the user base, Europe and North America also remain important audiences for Perplexity AI.
3. Traffic Growth Over Time
This section focuses on how Perplexity AI’s website traffic has increased from 2023 to 2025. It shows clear trends in monthly visits and reflects the platform’s accelerating adoption.
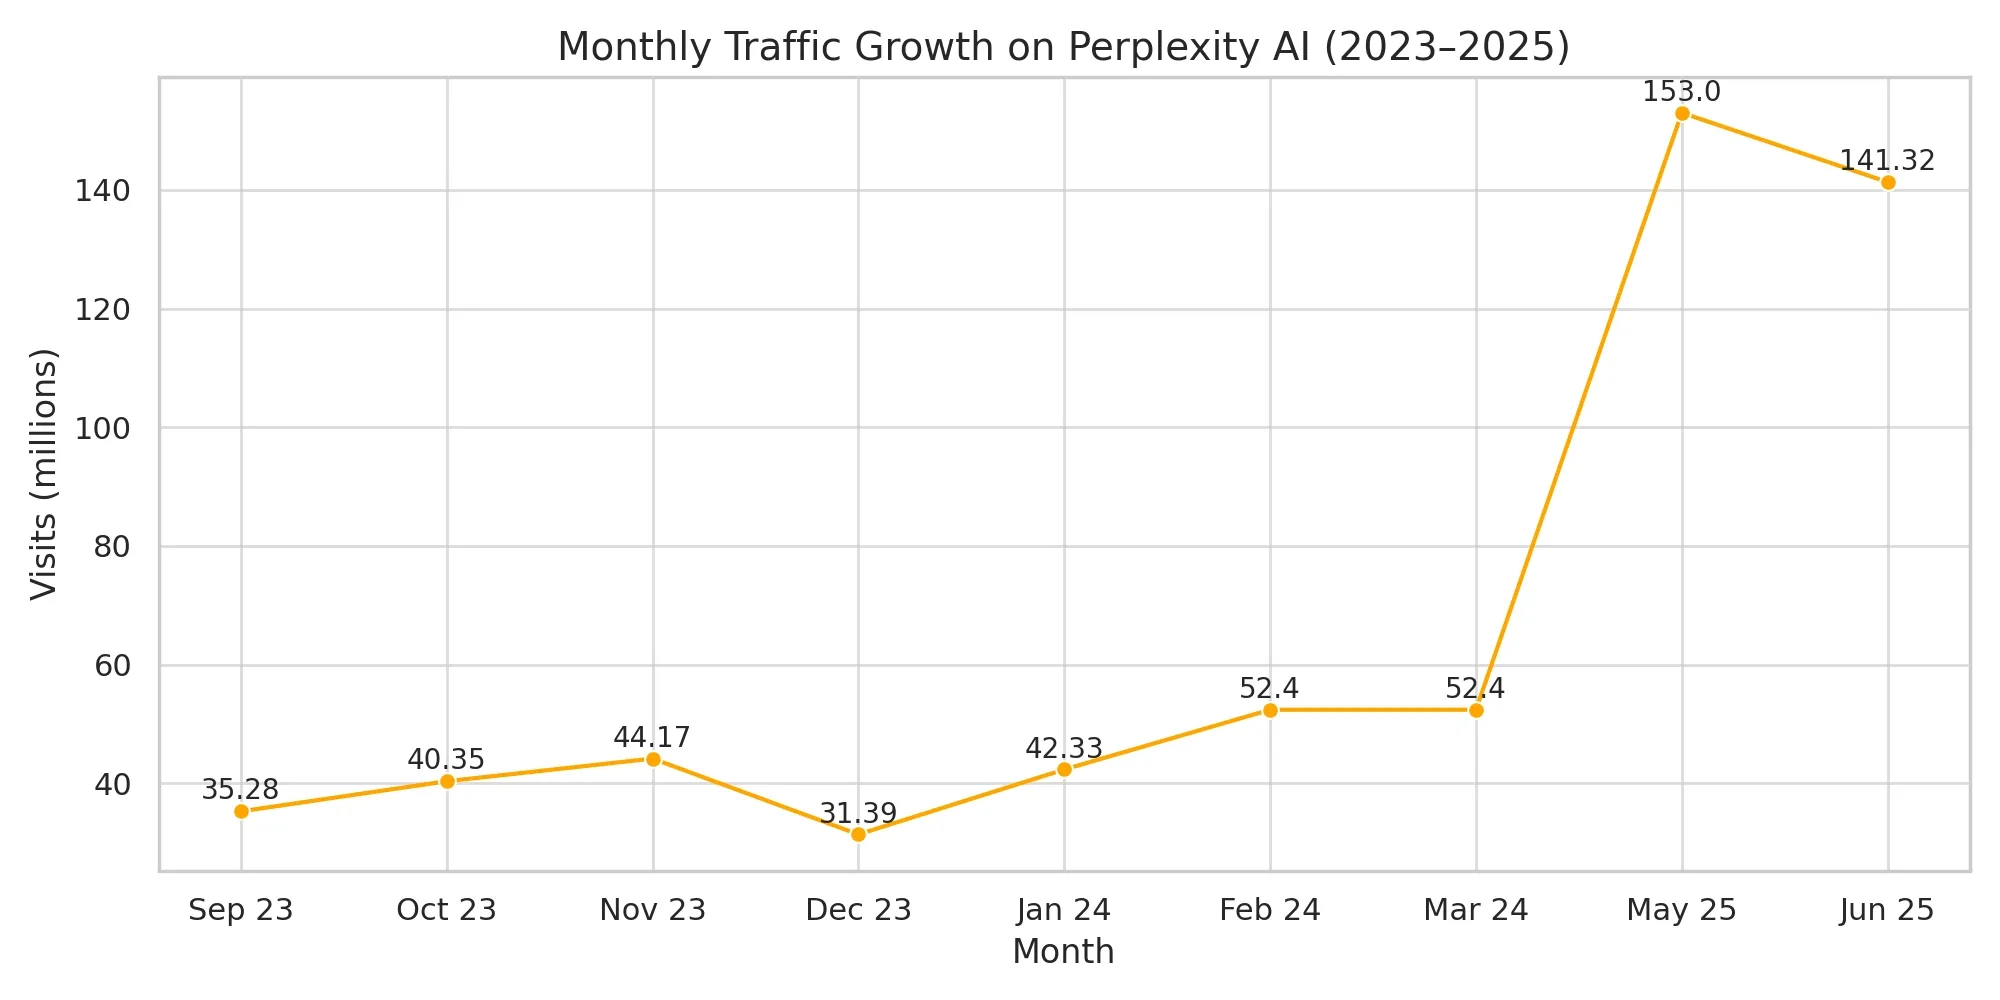
- In September 2023, Perplexity AI received 35.28 million total visits, showing its early-stage traction.
- By October 2023, traffic had grown to 40.35 million visits, continuing its upward trend.
- In November 2023, total visits reached 44.17 million, marking steady month-on-month growth.
- In December 2023, traffic dipped slightly to 31.39 million, likely due to seasonal changes.
- At the start of the new year, January 2024 recorded a strong rebound with 42.33 million visits.
- In February 2024, the platform’s popularity climbed further, reaching 52.4 million monthly visits.
- Just over a year later, in May 2025, Perplexity AI logged an impressive 153 million visits, reflecting a 191.9% increase compared to March 2024 figures.
- By June 2025, the platform attracted 141.32 million visits, maintaining high volume despite a slight month-over-month drop.
- The platform currently sees around 2 million visits per day, indicating strong daily engagement and sustained usage.
This timeline confirms Perplexity AI’s rapid growth in monthly traffic and increasing global visibility over time.
4. Query Volume and Growth Rate
This section highlights the number of search queries Perplexity AI has processed over time, showing how fast the platform is scaling. From just a few thousand daily queries to hundreds of millions per month, the growth has been exponential.
- In 2022, Perplexity AI handled just 3,000 queries per day, marking its earliest usage phase.
- By August 2024, the platform was processing 230 million search queries per month, showing major growth within two years.
- During 2024 as a whole, Perplexity handled over 500 million total queries, underlining its growing relevance in the AI search market.
- In May 2025, Perplexity reached a new peak by processing 780 million queries in a single month, which equals around 30 million queries per day.
- As of mid-2025, the platform is handling more than 100 million queries every week, reflecting steady, high-volume engagement.
- At Bloomberg’s Tech Summit, CEO Aravind Srinivas announced a goal to reach 1 billion weekly queries by the end of 2025.
- Achieving this milestone would represent more than a 30% increase from the current weekly query volume.
- Based on current growth trends, Perplexity is expected to process over 3 billion queries in 2025 alone, a significant jump from the 500 million recorded in 2024.
These numbers illustrate Perplexity’s fast adoption rate as users seek alternatives to traditional search engines.
5. Device Usage Patterns
This section explains how users access Perplexity AI, whether from mobile devices or desktops, and how preferences vary across different regions. These patterns help explain how people interact with the platform based on location and device availability.
- In 2025, mobile usage leads overall, with 63.53% of all users accessing Perplexity AI via mobile devices, while 36.47% use desktops.
- Indonesian users show the highest mobile preference, with 92.53% of them using smartphones or tablets to access the platform.
- In contrast, users in the United States prefer desktops, with 59.69% of American users accessing the site from desktop computers.
- During March 2025, desktop visits reached 133.3 million, compared to only 26.4 million mobile visits, showing a month where desktop traffic sharply dominated.
- In June 2025, the device share was still skewed towards desktops, with 82.51% of visits coming from desktops and only 17.49% from mobile devices.
These device usage trends suggest that while mobile dominates globally, desktop usage remains strong in regions like the U.S. and during periods of high research activity.
6. Traffic Sources
This section explains where Perplexity AI's visitors come from whether they type the URL directly, find it through search engines, or arrive via social media platforms. This gives insight into user behaviour and the effectiveness of Perplexity’s visibility across the web.
- The majority of Perplexity AI's traffic, almost 82% comes from direct visits, meaning users are typing in the URL or using bookmarks, which reflects high brand recall and repeat engagement.
- Around 11.65% of traffic comes from organic search, primarily via platforms like Google, suggesting good visibility in search engine results for AI-related queries.
- Social media contributes a smaller share of traffic, but still plays a role in discovery. Among social platforms:
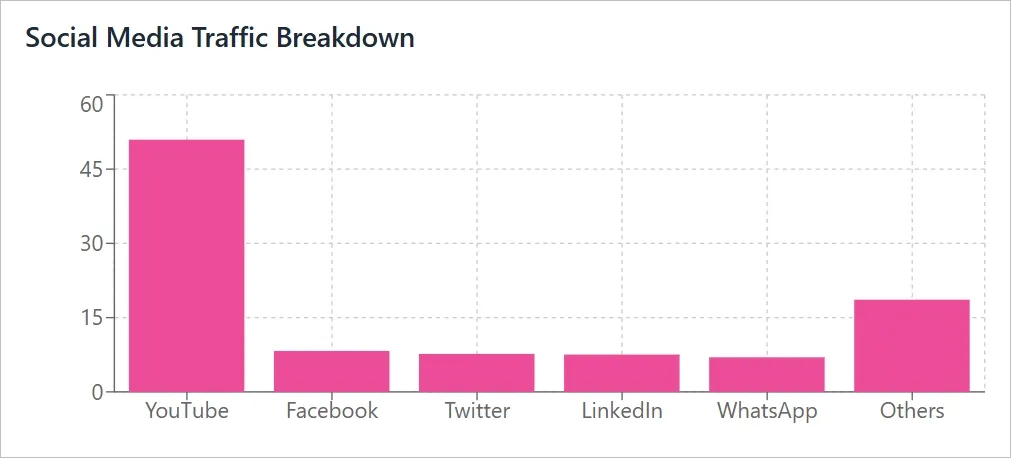
- YouTube drives 50.95% of all social media traffic to Perplexity
- Facebook contributes 8.26%
- Twitter (X) accounts for 7.67%
- LinkedIn generates 7.53%
- WhatsApp brings in 6.98%
- Other platforms account for the remaining 18.62% of social referrals
The dominance of direct traffic shows strong user loyalty, while YouTube stands out as the most impactful social channel for user acquisition.
7. Perplexity AI User Behaviour Metrics
This section outlines how users behave once they land on Perplexity AI, including how long they stay, how many pages they explore, and how often they leave without interacting. These metrics help measure engagement and content effectiveness.
- On average, a visitor spends 23 minutes and 10 seconds on Perplexity AI per session. This long duration suggests that users actively explore content and conduct deeper research.
- Each user views about 4.64 pages per visit, showing that people typically navigate through multiple threads, searches, or results before exiting.
- The platform’s bounce rate is 42.19%, meaning that around 4 in 10 users leave the site after viewing just one page. This is relatively low for a content-heavy platform and indicates strong engagement overall.
These behaviour patterns show that Perplexity users are not only returning frequently but also spending time exploring its AI-powered responses in depth.
8. Perplexity AI Performance and Accuracy
This section focuses on how well and how fast Perplexity AI delivers answers. It includes response time, output accuracy, and how the platform compares to traditional and AI-based search engines. These metrics reflect the platform’s technical strength and reliability.
- Perplexity AI delivers simple answers in just 1.2 seconds on average, making it one of the fastest AI search tools available.
- For more complex questions, the average response time is still quick at 2.5 seconds, enabling efficient research and multitasking.
- The platform maintains a 95% accuracy rate in its search results, driven by real-time web browsing and advanced language models.
- Compared to traditional search engines, Perplexity performs 15% better in delivering relevant and accurate results.
- It also outperforms most other AI-based search tools by 10%, making it a reliable choice for users looking for faster and smarter search experiences.
- According to SE Ranking’s research on AI search engines, Perplexity AI provides longer responses (21 sentences on average) with an average of 5 links per response, making it great for deep research and finding information sources.
These benchmarks demonstrate Perplexity’s technical edge and explain why so many users return regularly for research and quick answers.
9. Perplexity AI Revenue and Valuation
This section outlines Perplexity AI’s financial growth, including its valuation milestones and recurring revenue. These figures reflect the company’s commercial success and investor confidence in its business model.
- In January 2024, Perplexity AI was valued at approximately $520 million, reflecting its early traction and potential in the AI space.
- By May 2025, the company’s valuation had jumped to $18 billion, marking an enormous leap within 16 months, largely driven by user growth, query volume, and upcoming product launches.
- Perplexity currently earns over $100 million in annual recurring revenue (ARR), showcasing a sustainable and fast-growing revenue stream supported by its expanding user base and platform utility.
These valuation and revenue numbers confirm Perplexity’s position as one of the most successful AI startups in the search and productivity space.
FAQs
1. How many users are actively using Perplexity AI in 2025?
Perplexity AI has more than 22 million active users across its web and mobile platforms in 2025. On average, 2 million people visit the platform every day, reflecting high engagement and daily usage from a global audience.
2. How many search queries does Perplexity AI handle each month?
In May 2025 alone, Perplexity AI processed over 780 million search queries. This equals around 30 million queries per day, showing the platform’s massive scale and strong demand as an AI-powered search engine.
3. Which countries contribute the most traffic to Perplexity AI?
The United States and India are the top traffic sources for Perplexity AI in 2025. Other leading countries include Germany, South Korea, and Japan. Overall, the platform is accessible in 238 countries, making it one of the most globally adopted AI tools.
4. What devices do users prefer for accessing Perplexity AI?
Most users access Perplexity AI on mobile devices, which account for 63.5% of total sessions. However, desktop usage is still significant at 36.5%, especially in countries like the United States where desktop research remains common.
5. How fast and accurate are Perplexity AI’s responses?
Perplexity AI delivers simple responses in just 1.2 seconds, while complex answers take about 2.5 seconds. The platform maintains a 95% accuracy rate, making it one of the most reliable and efficient AI search tools available today.
6. Where is the data in this article sourced from?
All the statistics shared in this article are based on publicly available data and trusted sources. We have added original source links at the end of the article to ensure transparency and accuracy for readers and researchers.
💡 Explore our other services in the UAE:
- Best UI UX Design Agency In Dubai (300+ Clients)
- SaaS SEO Agency In Dubai, UAE
- Top SaaS UI UX Design Agency In Dubai, UAE
- SaaS SEO Agency In Dubai, UAE
💡 Explore our services in the UK:
- UI UX Design Agency in London, UK
- SEO growth services in London, UK
- SaaS Development Company in London, UK
Final words
Perplexity AI is changing how people search and learn online. With fast answers, strong user trust, and global reach, it continues to grow as a reliable AI search platform. Whether you're a casual user or a tech expert, Perplexity offers a smarter, simpler way to explore information.
👉 Explore our other statistical roundup:
- Branding Statistics
- Web Design Statistics
- AI Agents Statistics: Usage, ROI, & Industry Trends
- Product Development Statistics
- DeepSeek Statistics- Usage & Performance Benchmarks
- Interesting UX Statistics to Bookmark
- Github Copilot Usage Data Statistics
Data sources
- explodingtopics.com
- semrush.com
- wired.com
- wikipedia.org
- similarweb.com
- techcrunch.com
- perplexity.ai
- adweek.com
- finance.yahoo.com
- unite.ai
- tech.yahoo.com
- opentools.ai
- play.google.com
- ndtv.com
Need help in developing your AI application or software? Get a free proposal.
Need help in developing your AI application or software? Get a free proposal.


Got an idea on your mind?
We’d love to hear about your brand, your visions, current challenges, even if you’re not sure what your next step is.
Let’s talk


