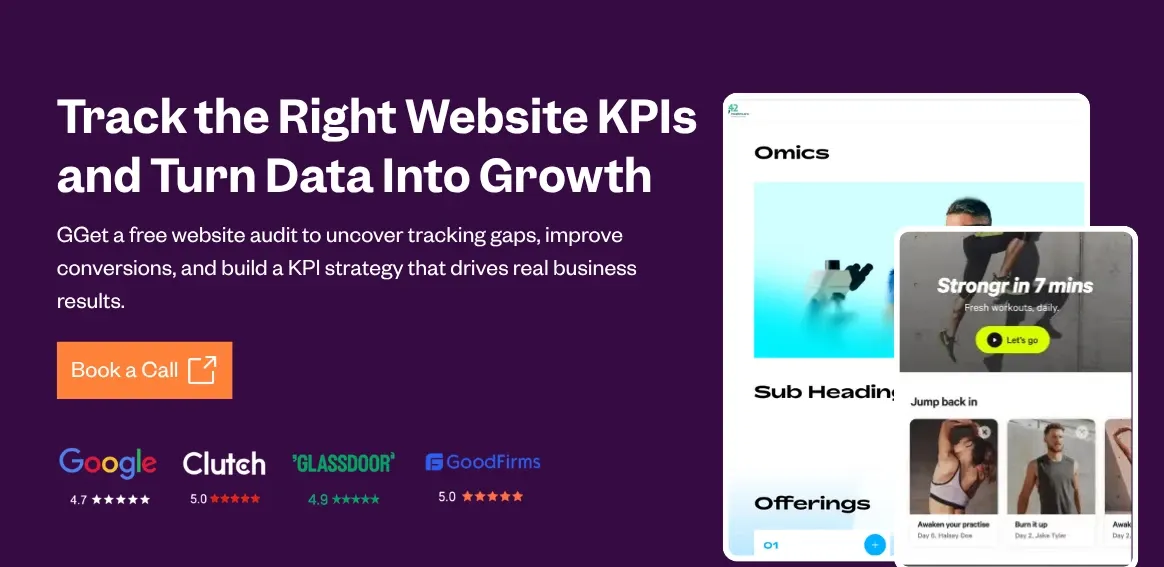
🤔 Does Your Marketing Team Track These 18 Website KPIs?
Share
Share

Get a quick blog summary with


Websites produce endless metrics, but only a few work as meaningful KPIs.
The website KPIs in this guide focus on what actually drives results: bringing in the right users, keeping them engaged, converting them into leads or customers, and getting them to return.
To make this practical, we’ve organized the KPIs into four clear categories: website user acquisition, engagement, conversion, and retention.
Each KPI is chosen because it’s actionable, measurable, and tied to real outcomes like lead quality, revenue, or long-term growth.
For every metric, we explain what it measures, why it matters, and how to track it using common analytics tools, so you can focus on improving—not just reporting.
1. Traffic growth month over month
This KPI calculates the percentage change in total sessions or users from one month to the previous month. It reveals if your marketing channels, SEO efforts, or content distribution are bringing in more visitors over time, rather than relying on short bursts.
For example, a B2B lead-generation site that creates case studies and promotes them via email saw sessions increase by 18% month over month after refining subject lines and segmentation, proving the changes built sustained awareness among target accounts.
Tracking this helps you spot early signs of channel fatigue or success, so you can double down on what works or fix declining sources before they impact lead volume or revenue.
Here this GA4 table shows traffic growth month-over-month with percentage changes highlighted.

Where to track:
GA4: Reports → Acquisition → Traffic acquisition report; apply date comparison to the previous period.
When to track:
Monthly, because daily or weekly numbers fluctuate too much from weekends, holidays, or one-off campaigns, hiding the real growth trend.
2. Total unique users
This counts the number of distinct individuals who started at least one session on your site during the selected period, using GA4's Total users metric. It measures the true breadth of your audience reach, separating new people from repeat visits.
For instance, an e-commerce site selling fitness equipment ran influencer partnerships and reached 65,000 unique users in a month; when conversions stayed low at 8%, it showed the influencers brought viewers but not buyers, leading to shifts toward performance-based creators.
Tracking this tells you if awareness efforts attract fresh visitors and flags mismatches when reach grows but quality doesn't.
This image displays total users alongside event activity per visitor.

Where to track:
GA4: Reports → Acquisition → User acquisition report (look at the Total users card or table).
When to track:
Monthly for most sites, or weekly if traffic volume is high enough to make short-term changes meaningful without noise.
3. Traffic source and medium
This breaks down sessions by where they originated (source, like Google or linkedin.com) and how (medium, like organic, cpc, or referral). It shows which paths deliver volume and which deliver visitors likely to engage or convert.
For example, a lead-generation site for consulting services found LinkedIn / cpc sessions were half the volume of Facebook / cpc but produced four times more demo requests, prompting a full budget shift to LinkedIn.
Tracking this lets you identify high-quality channels, pause waste, and refine targeting or landing pages for specific sources.
Here, this GA4 screenshot shows traffic acquisition by session source/medium breakdown with engagement metrics.

Where to track:
GA4: Reports → Acquisition → Traffic acquisition report; change primary dimension to Session source/medium.
When to track:
Weekly, so you can react fast to paid campaign performance or sudden drops in key sources.
4. Active users from AI referral platforms
This measures sessions or users arriving via referrals from AI tools such as ChatGPT, Perplexity, Gemini, Claude, or similar domains. As AI responses increasingly include clickable links to sources, this traffic indicates your content is being cited and driving real visits.
For example, a content site publishing in-depth guides noticed 10% of weekly sessions from perplexity.ai referrals, with those users spending 30% more time on page than organic search visitors, signaling strong fit for AI summaries and prompting more structured data markup.
Tracking this separately reveals an emerging channel's value and guides content tweaks to appear more in AI outputs.
Below this visual showing AI referrals in GA4:

Where to track:
GA4: Reports → Acquisition → Traffic acquisition report (change dimension to Session source or Session source/medium and search/filter for AI domains); for easier ongoing view, create a custom channel group in Admin → Channel settings with regex matching common AI domains, or use Explore → Free form exploration with a filter on Session source containing known AI patterns.
When to track:
Weekly, since this traffic can spike quickly with viral AI mentions or feature updates, allowing timely content adjustments.
⚒️ Explore our free tools useful for website acquisition KPIs calculation:
- Conversion Rate Calculator for Marketers
- CPC Calculator Free: Calculate Cost-Per-Click Online
- Free CTR Calculator Better Ad Performance
- Free Cost Per Acquisition Tool: CPA using CPM Calculator
Website engagement KPIs
5. Average engagement time per active user
This KPI shows how much time users actively spend on your site during a given period. It counts real interaction like scrolling, clicking, and viewing content in the foreground, not idle tabs. This makes it a stronger signal of attention than session duration.
For example, an e-commerce site added short product demo videos and increased average engagement time from 1:20 to 2:45 minutes per user, which led to a 14 percent lift in add-to-cart actions.
Tracking this helps you understand whether content updates or design changes actually hold attention and support better conversions or lead quality.
Here is an image that shows the overview session of GA4, representing Average engagement time per user:

Where to track:
GA4: Reports → Engagement → Overview, using the Average engagement time card.
When to track:
Monthly for long term trends, or weekly after major site or content updates.
6. Average engagement time per page
This KPI measures how long users actively engage with a specific page while it is visible in their browser. It helps identify pages that keep attention versus pages users skim or abandon quickly.
For instance, a lead generation site simplified a service page by shortening paragraphs and improving structure. Engagement time increased from 28 seconds to 1:12 minutes, and form submissions doubled.
Tracking this helps you spot content or layout issues early and improve pages that play a key role in the conversion journey.
This image shows average engagement time per page across top-performing content in GA4.

Where to track:
GA4: Reports → Engagement → Pages and screens, using the Average engagement time column.
When to track:
Weekly, so changes to copy or layout can be evaluated quickly.
7. Views per session
This KPI shows the average number of pages a user views in a single session. A higher number usually means visitors are exploring instead of leaving after one page.
For example, a content site added clearer internal links at the end of articles. Views per session increased from 1.8 to 3.2, which also raised time on site and ad impressions.
Tracking this reveals whether your navigation, internal linking, and content structure encourage deeper exploration and move users closer to conversion.
Where to track:
GA4: Reports →Engagement → Pages and screens, using the Views per session metric.
When to track:
Weekly for content-heavy sites, monthly for lead gen or ecommerce sites.
8. Bounce rate
In GA4, bounce rate indicates the percentage of sessions where users did not engage. These sessions lasted under 10 seconds, triggered no key event, and viewed fewer than two pages. It highlights visits where expectations were not met.
For example, a paid landing page had a 78 percent bounce rate. After improving the headline and adding a short CTA video, bounce rate dropped to 42 percent and form fills rose by 35 percent.
Tracking this helps identify weak traffic sources, unclear messaging, or poor page experience.
This GA4 funnel reveals bounce rates across organic, social, and direct channels.

Where to track:
GA4: Reports → Acquisition → Traffic acquisition, after adding Bounce rate to the metrics.
When to track:
Weekly, especially for paid campaigns and landing pages.
9. User stickiness (DAU/MAU ratio)
This KPI compares daily active users to monthly active users to show how often people return. A higher ratio means your site is becoming part of a regular habit.
For example, a content site introduced daily notifications and saw stickiness rise from 12 percent to 28 percent. This led to stronger repeat traffic and higher lifetime value.
Tracking this helps you understand long term engagement and loyalty, which matters for content platforms, ecommerce growth, and repeat lead generation.
Where to track:
GA4: Reports → Engagement → Overview, using the User stickiness card.
The following GA4 visual shows user stickiness trends with DAU/MAU/WAU ratios over time.

When to track:
Monthly, since it relies on a full rolling window of active users.
Explore our free tools useful for website engagement KPIs:
- Measure Net Promoter Score (NPS) Calculator Instantly
- Measure Net Promoter Score (NPS) Calculator Instantly
- Aspect Ratio Calculator Online for Perfect Image Resizing
- HTTP Status Code Checker (Check Bulk URLs)
Website conversion KPIs
10. Conversion rate (key events)
This KPI measures the percentage of sessions or users that complete a marked key event, such as a purchase, form submission, or demo request. It shows how effectively your site turns visitors into actions that matter to the business.
For example, a lead-generation site offering SaaS trials set form_submit as a key event; after redesigning the pricing page, the conversion rate rose from 4.2% to 7.8% of sessions, directly increasing qualified leads by 85%.
Tracking this reveals if traffic quality, page design, or funnel friction is helping or hurting goal completion.
Where to track:
GA4: Reports → Engagement → Conversions (view Key event rate or add it to Acquisition reports).
When to track:
Weekly for most sites, or daily during active campaigns or tests to spot lifts or drops quickly.
11. Traffic-to-lead conversion rate
This calculates the number of lead-related key events (like form fills, chat starts, or downloads) divided by total sessions or users. It focuses specifically on lead volume rather than all conversions.
For instance, a B2B services site tracked contact form submissions per session; a low 1.8% rate on mobile traffic led to fixing a broken form field, raising it to 4.1% and adding 120 leads per month.
Tracking this helps you measure lead flow health and decide where to improve forms, CTAs, or trust signals.
Where to track:
GA4: Reports → Engagement → Conversions (filter to lead events) or create a custom Exploration showing key events divided by sessions.
When to track:
Weekly, to balance a reliable sample size with timely funnel improvements.
12. E-commerce conversion rate (purchase)
This is the percentage of sessions that end in a completed purchase event. It directly ties traffic to revenue generation.
For example, an online store selling home goods saw a purchase conversion rate stuck at 2.1%; adding trust badges and free-shipping thresholds lifted it to 3.4%, adding $28,000 in monthly revenue without extra traffic.
Tracking this shows if product pages, checkout flow, or pricing changes actually drive sales.
This GA4 table shows purchase conversion rates by traffic source, including direct and Google channels.

Where to track:
GA4: Reports → Monetization → Overview (E-commerce purchases and Purchase conversion rate).
When to track:
Weekly during normal periods, daily during sales or promotions, to monitor performance in real time.
13. Average order value
This divides total revenue from purchase events by the number of purchase events in the period. It measures how much customers spend per transaction.
For instance, an e-commerce site introduced bundled product recommendations at checkout; average order value increased from $82 to $112, boosting revenue 36% even with flat conversion rates.
Tracking this guides upsell, cross-sell, and pricing decisions that lift revenue without needing more traffic.
The image given below displays average purchase revenue per user trending over time.

Where to track:
GA4: Reports → Monetization → Overview (Average purchase revenue metric).
When to track:
Monthly, because short-term fluctuations from discounts or seasons can mask the impact of lasting changes.
14. Goal value per session
This assigns a monetary value to non-ecommerce conversions (like leads or sign-ups) and averages it across all sessions. It translates lead-gen actions into estimated revenue impact.
For example, a consulting firm assigned $150 goal value to each qualified form submit; after content upgrades, value per session rose from $1.80 to $3.40, justifying higher content spend.
Tracking this helps compare channel ROI when direct sales aren't the goal.
Where to track:
GA4: Reports → Engagement → Conversions (after assigning monetary values to key events in Configure → Events → Mark as key event → Edit → Assign value).
When to track:
Monthly, to align with the sales cycle length and lead valuation accuracy.
Website retention KPIs
15. Returning users percentage
This KPI shows the share of total users in a given period who have visited the site before, as opposed to first-time visitors. It measures whether people find enough value to come back instead of relying entirely on new traffic.
For example, a lead-generation site for financial planning launched a monthly newsletter with market insights; over three months, returning users increased from 22% to 41% of total users, leading to more repeat form submissions from warmer prospects.
Tracking this indicates whether loyalty drivers like email, content series, or logged-in features are working and helps reduce dependency on constant acquisition spend.
This GA4 screenshot shows new vs returning users split with engagement trends.
Where to track:
GA4: Reports → Retention → Overview (New vs Returning users)
When to track:
Monthly, to allow enough time for return visits and meaningful trends to emerge.
16. User retention by cohort
This tracks the percentage of users from a specific acquisition cohort (for example, users who first visited in January) who return in subsequent weeks or months. It reveals how well you retain users over time and highlights when drop-off occurs.
For instance, an e-commerce subscription brand saw month-1 retention fall to 18% for a new cohort; after adding personalized reorder reminders, retention increased to 37%, significantly improving lifetime value.
Tracking retention by cohort helps you pinpoint churn timing and test whether retention initiatives are effective for different user groups.
Where to track:
GA4: Explore → Cohort exploration (or Free form with cohort settings)
When to track:
Monthly, using consistent cohort windows to compare retention trends over time.
17. Repeat purchase rate
This KPI measures the percentage of customers who make more than one purchase within a defined timeframe, such as 30, 60, or 90 days. It focuses on customer loyalty rather than first-time sales.
For example, an online apparel store tracked users with two or more purchases within 90 days; after launching a loyalty points program, repeat purchase rate rose from 14% to 29%, driving the majority of revenue growth.
Tracking this shows whether post-purchase emails, incentives, and product quality encourage customers to return.
Where to track:
GA4: Explore → Cohort exploration or Free form exploration (filter users with multiple purchase events)
When to track:
Monthly or quarterly, since repeat purchases require time after the initial transaction.
18. Engagement time for returning users
This compares average engagement time for returning users across sessions or over time, showing whether repeat visitors continue to find value in your site. Higher engagement from returners usually signals stronger content relevance or product usefulness.
For example, a content site found that returning users spent 40% more time per session than new users; when that gap narrowed, they refreshed older articles and restored higher engagement from loyal readers.
Tracking this helps detect content fatigue early and confirms whether updates keep repeat visitors interested.
Where to track:
GA4: Explore → Free form (segment by User type: Returning users) or Engagement reports with user-type comparisons
When to track:
Monthly, to align with retention and returning-user measurement windows.
Check 👀out these guides for future reference:
⚒️ Here are our free tools to help you optimize your marketing KPIs:
- Measure how many visitors complete key actions like sign-ups or purchases with conversion rate calculator.
- Track how often users click on ads or CTAs to judge message effectiveness using CTR calculator.
- Estimate cost per acquisition from CPM based campaigns with CPA calculator using CPM.
- Analyze drop offs and revenue across each funnel stage using sales funnel calculator.
- Measure customer loyalty and satisfaction scores with NPS calculator.
Track customer loss over time to understand retention issues using churn rate calculator.
Get a free website audit from our experts at Tenet
After working with clients in 15+ countries and completing 450+ projects, we’ve seen where analytics setups fail and where they can actually help your business grow.
From SaaS platforms to high-volume ecommerce sites, we help teams understand what the data is really showing, so you can focus on the changes that make a real difference.
We do more than send a PDF of charts. We check your GA4 setup, user journeys, and conversion paths to find the points where you are losing leads, whether it is a tracking issue or a checkout step that drives buyers away.
Then we give you a clear, prioritized list of fixes that you can start using right away.
If you want to see your KPIs clearly and get a simple plan to improve conversions, let’s look at your site together.
👉 Learn how our website development services can help you drive qualified traffic and generate revenue for your business. Get your free audit today.
Turn your website into a growth engine. Get expert development, tracking, and conversion fixes today.
Turn your website into a growth engine. Get expert development, tracking, and conversion fixes today.


Got an idea on your mind?
We’d love to hear about your brand, your visions, current challenges, even if you’re not sure what your next step is.
Let’s talk


